Introduction: Why Graphical Abstracts Matter
In today’s fast-moving academic world, researchers and readers often decide within seconds whether a paper is worth exploring. A graphical abstract works like a visual elevator pitch, capturing the essence of the entire study in one clear and compelling image. It not only enhances the appeal of a journal article but also helps readers to grasp complex ideas within moments. A strong graphical abstract is more than a decorative element; it is a visual narrative that presents the problem, the process, and the findings in a simple and accurate format.
What is Graphical Abstract?
A graphical abstract is a single visual representation of your research that illustrates the core elements of the study. It shows the research problem, the process or method used to investigate it, the significant findings, and the final impact or implication. It may include
- Icons
- Diagrams
- simple illustrations
- Flowcharts
- Conceptual models
- schematic designs.
The goal is to allow the viewer to understand the entire research at a glance without reading the full article.
Why Graphical Abstracts Are Becoming Essential
Graphical abstracts are increasingly required by journals because they significantly improve visibility, engagement, and accessibility. Readers prefer visually summarised information, and graphical abstracts make it easier for research to circulate on platforms like Google Scholar, LinkedIn, and academic forums. They also support better interdisciplinary understanding by simplifying complex ideas for readers from different backgrounds. As a result, papers with effective graphical abstracts often receive more attention and more citations.
How a Graphical Abstract Simplifies Complex Research
A graphical abstract condenses detailed research into a visual model that communicates information efficiently. Long textual explanations can be transformed into easy-to-follow workflows, cause-and-effect diagrams, or conceptual illustrations. This reduces the cognitive load on the reader and allows them to understand the research logic in a more intuitive and structured way. In just a few seconds, a viewer can see the main idea, understand the approach, and interpret the key findings.
Key Elements of an Effective Graphical Abstract
A high-quality graphical abstract maintains simplicity, accuracy, and strong visual balance. It should include only essential components and avoid unnecessary decoration. The visuals must follow a logical flow that guides the viewer from the problem to the method and finally to the outcome. Icons and colours must remain consistent, scientifically appropriate, and easy to view . Above all, the graphical abstract should remain clear and readable across different devices, including mobile screens, ensuring accessibility for all users.
Types of Graphical Abstracts You Can Use
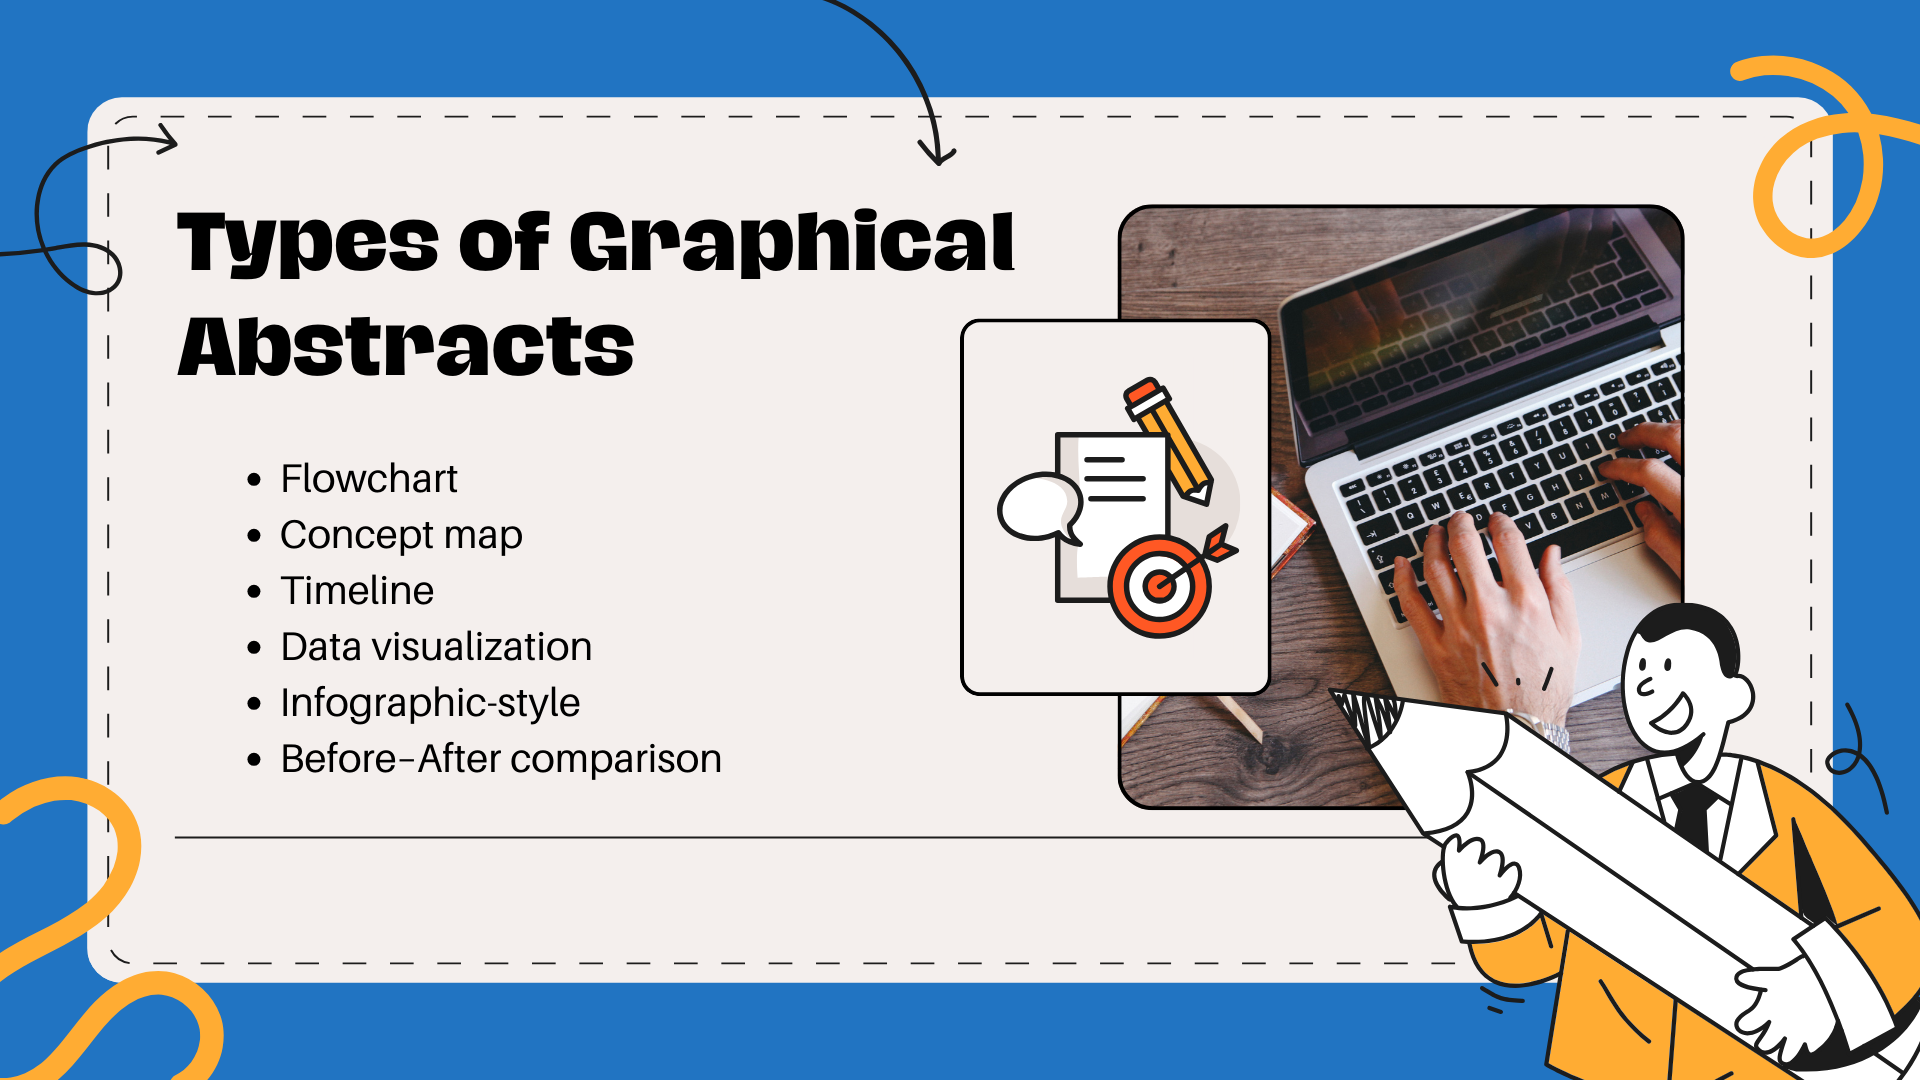
Different studies benefit from different styles of graphical abstracts.
A flowchart works best for step-by-step methods or experimental procedures. A concept map is more suitable for theoretical or framework-based studies. A timeline is ideal for chronological research, while a before-after model is effective for interventions or comparisons. Minimalist schematic diagrams are common in chemistry and biology because they convey detailed processes with clarity. Infographic-style visuals are useful for applied sciences, public health, or environmental studies where broad audiences must understand the message quickly.
Best Tools to Design Graphical Abstracts
Both free and advanced tools can help create a polished graphical abstract. Platforms like Canva, PowerPoint, BioRender, and Inkscape offer accessible options with templates and icons suitable for research communication. For more advanced users, software like Adobe Illustrator or CorelDRAW provides detailed control over color, shape, and design. The choice depends on your comfort level and the journal’s quality requirements, but even simple tools can produce excellent results if the design is clear and focused.
Step-by-Step Guide to Creating a Graphical Abstract
The process begins with identifying the single most important message your reader should learn from your research. Once that is clear, choose a layout that suits your study, whether vertical, horizontal, or centrally focused. Sketching the idea on paper first helps refine the visual flow. Select illustrations and icons that match the scientific content, then add brief, informative labels to guide the viewer. Use a clean color palette with only a few complementary shades to keep the design professional. Finally, check the journal’s size, format, and resolution guidelines and test your design on multiple screens to ensure readability.
Common Mistakes to Avoid
Many authors make the mistake of adding too much text or cluttering the design with unnecessary icons and bright colors. These elements distract from the main message and reduce clarity. A graphical abstract should be visually clean and scientifically accurate, without distorting data for decorative purposes. Another frequent problem is ignoring journal requirements, which may result in rejection or the need for redesign. Keeping the design focused and compliant ensures smooth submission.
How Graphical Abstracts Strengthen Research Impact
An effective graphical abstract increases citation rates, improves visibility on academic platforms, and makes research more accessible to non-experts. It helps to remember of the paper and supports communication in conference presentations, seminars, and digital platforms. As journals continue to prioritize visual summaries in 2025 and beyond, mastering graphical abstract design has become an essential academic skill.
Conclusion
A graphical abstract is a powerful visual tool that communicates your research article in seconds. By keeping the design simple, accurate, and visually organized, you can turn even the most complex study into an engaging and professional summary. A well-designed graphical abstract delivers clarity, improves visibility, and adds meaningful impact to your academic work.
Tip to Remember
Always design your graphical abstract around one central message—Viewer should understand your research within 5-10 seconds
Example Graphical Abstract Description
For a study on urban microplastics, a strong graphical abstract might show a simple flow: polluted city sources leading to water pipelines, followed by a visual of microplastic particles identified under a microscope, and ending with a symbol for health or environmental risk. This single visual communicates the entire research process at a glance.