
Data from quantitative research can be analyzed using statistical methods. From sample data, predictions about a population can be tested with probabilities and models. The statistical analysis of quantitative data involves examining trends, patterns, and relationships. Currently, statistical tools are widely used by researchers, scientists, academicians, government agencies, businesses, and several other organizations. Data collected through an experiment or a probability sampling method can be subjected to statistical tests. The sample size of a statistical test must be large enough to accurately reflect the true distribution of the population to be studied. When deciding which statistical test to use to write, one must be aware of whether the data is consistent with certain assumptions and which variables are involved.
The statistical analysis needs to be carefully planned at the very beginning of the research process to draw valid conclusions. A researcher paper must specify their hypotheses and determine the design of their study, the sample size, and the sampling procedure. Data collected from the sample can be organized and summarized using descriptive statistics. Using inferential statistics, it is possible to formalize the process of testing hypotheses and estimating the population size. Findings can then be interpreted and generalized. A descriptive statistic summarizes the characteristics of a set of data. Inferential statistics are used to test hypotheses and evaluate whether the data on which they are based can be generalized to a broader population.
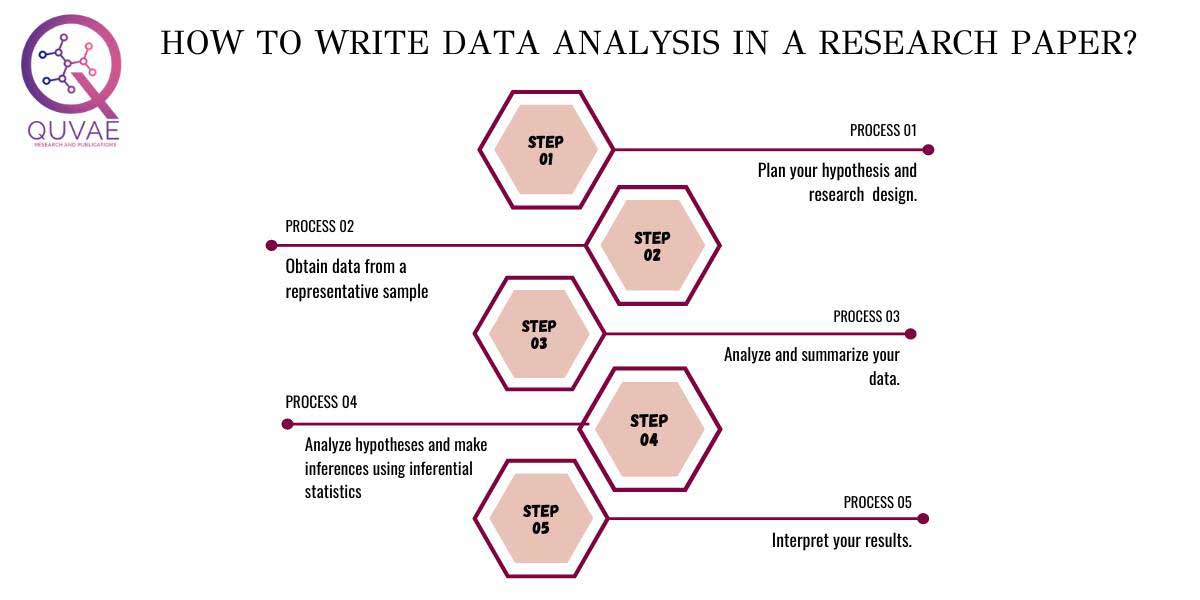
Step 1: Plan your hypothesis and research design
Specifying your hypotheses and designing your research will help you collect valid data for statistical analysis.
Analyzing statistical hypotheses
Researchers often examine the relationship between variables within a population. A prediction is the starting point, and statistical analysis allows you to test that prediction. A statistical hypothesis is a method for formulating a prediction about a population in a prescribed manner. The null and alternative hypotheses for each research prediction can be verified using the sample data. Although the null hypothesis always predicts no relationship between variables, the alternative hypothesis describes the relationship you predict from your research.
How to plan your research design
The research design refers to your method for gathering and analyzing data. This helps you determine what statistical test you will need to test your hypothesis. Determine whether you are applying an experimental approach, a descriptive approach, or a correlational approach in your research design. Studies using analysis and correlation do not directly affect variables, but only measure them, but experimental studies influence variables directly. We can investigate the relationships between variables by using a correlational design. The descriptive design involves the use of statistical tests to draw inferences from sample data about the characteristics of a population or phenomenon.
Measuring variables
Plan your research design by operationalizing your variables and deciding how they will be measured. The level of measurement of your variables is an important consideration when conducting statistical analysis. Categorical data consist of groups, while quantitative data are concerned with amounts. Making the right statistical and hypothesis testing choices is based on identifying the measurement level.
Step 2: Obtain data from a representative sample
Once you have used an appropriate sampling procedure when conducting statistical analysis, you can extend your conclusions beyond your sample. Probability sampling involves selecting participants at random from the population to conduct a study. In non-probability sampling, some members of a population have a higher chance of being selected than other members due to factors such as convenience or self-selection.
Step 3: Analyze and summarize your data
Your data can be examined and summarized with descriptive statistics after you have collected all the data.
Step 4: Analyze hypotheses and make inferences using inferential statistics
Numbers that describe a sample are called statistics, while numbers that describe the entire population are called parameters. Using inference statistics, you can conclude the characteristics of a population based on a sample. Based on the null hypothesis, statistical tests determine where the sampled data would fall in an expected distribution. There are two main outcomes of these tests: You can determine your test statistic by comparing your results with the null hypothesis. The test statistic measures how much your data deviate from the null hypothesis. A p-value helps you determine whether you are likely to obtain your results if your null hypothesis is true among the population.
Step 5: Interpret your results
Interpreting your findings is the final step of our statistical analysis.
Statistical significance
Conclusions are drawn from hypothesis testing based on statistical significance. The p-value of your results is compared with a set significance level (0.05) to determine whether they are statistically significant. The likelihood that statistically significant results arise from chance is highly unlikely. Such a result is extremely unlikely to occur in the population if the null hypothesis is true.
Analysing data and interpreting the results requires practice and guidance
Organization
The organisation is the key to writing a good report. An outline should include: 1) the problem overview, 2) the data analysis and model approach, 3) the results of the data analysis, and 4) the substantive conclusions.
Problem Overview
- Provide a description of the problem.
- Are you attempting to answer a substantive question?
- It doesn’t have to be long, but it should be clear.
Data Analysis and Model Approach
- Was your approach to addressing the question data-driven? If so, how?
- Be specific in describing your approach.
A Data and Model section will sometimes include graphs or tables, and sometimes not. Include a plot if you believe it will assist the reader in understanding the problem or data set itself, rather than your conclusions. While these tables provide important information about the data and approach, they do not provide information about the results of the study.
The results of the Data Analysis
Provide figures and tables that must support your argument in your results section. Label the images add informative captions, and refer to them in the text by their numbered labels. The following items might be included here: pictures of the data, pictures of the fitted model, a table of coefficients, and summaries of the model.
The Substantive Conclusions
- What conclusions did you draw from this analysis?
- Is there an answer to the question you set out to address?
Factors to consider when analyzing your research data
To demonstrate a high standard of research practice, researchers should possess adequate skills for analysing data. To gain better insights into data, it is ideal for researchers to understand the rationale for selecting one statistical method over another. The methods used in research and data analysis differ in scientific fields; therefore, designing a survey questionnaire, choosing data collection methods, and choosing a sample play a crucial role at the outset of an analysis. Analysing data in research presents accurate and reliable information. The most important thing researchers should remember when analysing data is to remain open and unbiased toward unpredictable patterns, results, and expressions.